-

在线客服
QQ扫码联系在线客服
QQ: 2292620539
-

新闻
-

公众号
微信扫码关注公众号
获免费课程和活动
-


在线客服
新闻
公众号
eBPF是一项革命性的技术,起源于 Linux 内核,可以在操作系统内核等特权上下文中运行沙盒程序。它可以安全有效地扩展内核的功能,而无需更改内核源代码或加载内核模块。 比如,使用ebpf可以追踪任何内核导出函数的参数,返回值,以实现kernel hook 的效果;通过ebpf还可以在网络封包到达内核协议栈之前就进行处理,这可以实现流量控制,甚至隐蔽通信。
ebpf本质上只是运行在linux 内核中的虚拟机,要发挥其强大的能力还是要跟linux kernel 自带的追踪功能搭配:
kprobe
uprobe
tracepoint
USDT
通常可以通过以下三种工具使用ebpf:
bcc
libbpf
bpftrace
BCC 是一个用于创建高效内核跟踪和操作程序的工具包,包括几个有用的工具和示例。它利用扩展的 BPF(Berkeley Packet Filters),正式名称为 eBPF,这是 Linux 3.15 中首次添加的新功能。BCC 使用的大部分内容都需要 Linux 4.1 及更高版本。
首先clone bcc 源码仓库
git clone https://github.com/iovisor/bcc.git git checkout v0.25.0 git submodule init git submodule update
bcc 从v0.10.0开始使用libbpf 并通过submodule 的形式加入源码树,所以这里需要更新并拉取子模块
安装依赖
apt install flex bison libdebuginfod-dev libclang-14-dev
编译bcc
mkdir build && cd build cmake -DCMAKE_BUILD_TYPE=Release .. make -j #n取决于机器的cpu核心数
编译安装完成后,在python3中就能使用bcc模块了 安装bcc时会在/usr/share/bcc目录下安装bcc自带的示例脚本和工具脚本,以及manual 文档 可以直接使用man -M /usr/share/bcc/man <keyword>来查询
bcc 自带的工具execsnoop可以跟踪execv系统调用,其源代码如下:
#!/usr/bin/python
# @lint-avoid-python-3-compatibility-imports
#
# execsnoop Trace new processes via exec() syscalls.
# For Linux, uses BCC, eBPF. Embedded C.
#
# USAGE: execsnoop [-h] [-T] [-t] [-x] [-q] [-n NAME] [-l LINE]
# [--max-args MAX_ARGS]
#
# This currently will print up to a maximum of 19 arguments, plus the process
# name, so 20 fields in total (MAXARG).
#
# This won't catch all new processes: an application may fork() but not exec().
#
# Copyright 2016 Netflix, Inc.
# Licensed under the Apache License, Version 2.0 (the "License")
#
# 07-Feb-2016 Brendan Gregg Created this.
from __future__ import print_function
from bcc import BPF
from bcc.containers import filter_by_containers
from bcc.utils import ArgString, printb
import bcc.utils as utils
import argparse
import re
import time
import pwd
from collections import defaultdict
from time import strftime
def parse_uid(user):
try:
result = int(user)
except ValueError:
try:
user_info = pwd.getpwnam(user)
except KeyError:
raise argparse.ArgumentTypeError(
"{0!r} is not valid UID or user entry".format(user))
else:
return user_info.pw_uid
else:
# Maybe validate if UID < 0 ?
return result
# arguments
examples = """examples:
./execsnoop # trace all exec() syscalls
./execsnoop -x # include failed exec()s
./execsnoop -T # include time (HH:MM:SS)
./execsnoop -U # include UID
./execsnoop -u 1000 # only trace UID 1000
./execsnoop -u user # get user UID and trace only them
./execsnoop -t # include timestamps
./execsnoop -q # add "quotemarks" around arguments
./execsnoop -n main # only print command lines containing "main"
./execsnoop -l tpkg # only print command where arguments contains "tpkg"
./execsnoop --cgroupmap mappath # only trace cgroups in this BPF map
./execsnoop --mntnsmap mappath # only trace mount namespaces in the map
"""
parser = argparse.ArgumentParser(
description="Trace exec() syscalls",
formatter_class=argparse.RawDescriptionHelpFormatter,
epilog=examples)
parser.add_argument("-T", "--time", action="store_true",
help="include time column on output (HH:MM:SS)")
parser.add_argument("-t", "--timestamp", action="store_true",
help="include timestamp on output")
parser.add_argument("-x", "--fails", action="store_true",
help="include failed exec()s")
parser.add_argument("--cgroupmap",
help="trace cgroups in this BPF map only")
parser.add_argument("--mntnsmap",
help="trace mount namespaces in this BPF map only")
parser.add_argument("-u", "--uid", type=parse_uid, metavar='USER',
help="trace this UID only")
parser.add_argument("-q", "--quote", action="store_true",
help="Add quotemarks (\") around arguments."
)
parser.add_argument("-n", "--name",
type=ArgString,
help="only print commands matching this name (regex), any arg")
parser.add_argument("-l", "--line",
type=ArgString,
help="only print commands where arg contains this line (regex)")
parser.add_argument("-U", "--print-uid", action="store_true",
help="print UID column")
parser.add_argument("--max-args", default="20",
help="maximum number of arguments parsed and displayed, defaults to 20")
parser.add_argument("--ebpf", action="store_true",
help=argparse.SUPPRESS)
args = parser.parse_args()
# define BPF program
bpf_text = """
#include <uapi/linux/ptrace.h>
#include <linux/sched.h>
#include <linux/fs.h>
#define ARGSIZE 128
enum event_type {
EVENT_ARG,
EVENT_RET,
};
struct data_t {
u32 pid; // PID as in the userspace term (i.e. task->tgid in kernel)
u32 ppid; // Parent PID as in the userspace term (i.e task->real_parent->tgid in kernel)
u32 uid;
char comm[TASK_COMM_LEN];
enum event_type type;
char argv[ARGSIZE];
int retval;
};
BPF_PERF_OUTPUT(events);
static int __submit_arg(struct pt_regs *ctx, void *ptr, struct data_t *data)
{
bpf_probe_read_user(data->argv, sizeof(data->argv), ptr);
events.perf_submit(ctx, data, sizeof(struct data_t));
return 1;
}
static int submit_arg(struct pt_regs *ctx, void *ptr, struct data_t *data)
{
const char *argp = NULL;
bpf_probe_read_user(&argp, sizeof(argp), ptr);
if (argp) {
return __submit_arg(ctx, (void *)(argp), data);
}
return 0;
}
int syscall__execve(struct pt_regs *ctx,
const char __user *filename,
const char __user *const __user *__argv,
const char __user *const __user *__envp)
{
u32 uid = bpf_get_current_uid_gid() & 0xffffffff;
UID_FILTER
if (container_should_be_filtered()) {
return 0;
}
// create data here and pass to submit_arg to save stack space (#555)
struct data_t data = {};
struct task_struct *task;
data.pid = bpf_get_current_pid_tgid() >> 32;
task = (struct task_struct *)bpf_get_current_task();
// Some kernels, like Ubuntu 4.13.0-generic, return 0
// as the real_parent->tgid.
// We use the get_ppid function as a fallback in those cases. (#1883)
data.ppid = task->real_parent->tgid;
bpf_get_current_comm(&data.comm, sizeof(data.comm));
data.type = EVENT_ARG;
__submit_arg(ctx, (void *)filename, &data);
// skip first arg, as we submitted filename
#pragma unroll
for (int i = 1; i < MAXARG; i++) {
if (submit_arg(ctx, (void *)&__argv[i], &data) == 0)
goto out;
}
// handle truncated argument list
char ellipsis[] = "...";
__submit_arg(ctx, (void *)ellipsis, &data);
out:
return 0;
}
int do_ret_sys_execve(struct pt_regs *ctx)
{
if (container_should_be_filtered()) {
return 0;
}
struct data_t data = {};
struct task_struct *task;
u32 uid = bpf_get_current_uid_gid() & 0xffffffff;
UID_FILTER
data.pid = bpf_get_current_pid_tgid() >> 32;
data.uid = uid;
task = (struct task_struct *)bpf_get_current_task();
// Some kernels, like Ubuntu 4.13.0-generic, return 0
// as the real_parent->tgid.
// We use the get_ppid function as a fallback in those cases. (#1883)
data.ppid = task->real_parent->tgid;
bpf_get_current_comm(&data.comm, sizeof(data.comm));
data.type = EVENT_RET;
data.retval = PT_REGS_RC(ctx);
events.perf_submit(ctx, &data, sizeof(data));
return 0;
}
"""
bpf_text = bpf_text.replace("MAXARG", args.max_args)
if args.uid:
bpf_text = bpf_text.replace('UID_FILTER',
'if (uid != %s) { return 0; }' % args.uid)
else:
bpf_text = bpf_text.replace('UID_FILTER', '')
bpf_text = filter_by_containers(args) + bpf_text
if args.ebpf:
print(bpf_text)
exit()
# initialize BPF
b = BPF(text=bpf_text)
execve_fnname = b.get_syscall_fnname("execve")
b.attach_kprobe(event=execve_fnname, fn_name="syscall__execve")
b.attach_kretprobe(event=execve_fnname, fn_name="do_ret_sys_execve")
# header
if args.time:
print("%-9s" % ("TIME"), end="")
if args.timestamp:
print("%-8s" % ("TIME(s)"), end="")
if args.print_uid:
print("%-6s" % ("UID"), end="")
print("%-16s %-7s %-7s %3s %s" % ("PCOMM", "PID", "PPID", "RET", "ARGS"))
class EventType(object):
EVENT_ARG = 0
EVENT_RET = 1
start_ts = time.time()
argv = defaultdict(list)
# This is best-effort PPID matching. Short-lived processes may exit
# before we get a chance to read the PPID.
# This is a fallback for when fetching the PPID from task->real_parent->tgip
# returns 0, which happens in some kernel versions.
def get_ppid(pid):
try:
with open("/proc/%d/status" % pid) as status:
for line in status:
if line.startswith("PPid:"):
return int(line.split()[1])
except IOError:
pass
return 0
# process event
def print_event(cpu, data, size):
event = b["events"].event(data)
skip = False
if event.type == EventType.EVENT_ARG:
argv[event.pid].append(event.argv)
elif event.type == EventType.EVENT_RET:
if event.retval != 0 and not args.fails:
skip = True
if args.name and not re.search(bytes(args.name), event.comm):
skip = True
if args.line and not re.search(bytes(args.line),
b' '.join(argv[event.pid])):
skip = True
if args.quote:
argv[event.pid] = [
b"\"" + arg.replace(b"\"", b"\\\"") + b"\""
for arg in argv[event.pid]
]
if not skip:
if args.time:
printb(b"%-9s" % strftime("%H:%M:%S").encode('ascii'), nl="")
if args.timestamp:
printb(b"%-8.3f" % (time.time() - start_ts), nl="")
if args.print_uid:
printb(b"%-6d" % event.uid, nl="")
ppid = event.ppid if event.ppid > 0 else get_ppid(event.pid)
ppid = b"%d" % ppid if ppid > 0 else b"?"
argv_text = b' '.join(argv[event.pid]).replace(b'\n', b'\\n')
printb(b"%-16s %-7d %-7s %3d %s" % (event.comm, event.pid,
ppid, event.retval, argv_text))
try:
del(argv[event.pid])
except Exception:
pass
# loop with callback to print_event
b["events"].open_perf_buffer(print_event)
while 1:
try:
b.perf_buffer_poll()
except KeyboardInterrupt:
exit()此工具使用kprobe和kretprobe跟踪execv系统调用的进入和退出事件,并将进程名,进程参数,pid,ppid以及返回代码输出到终端
bcc中使用uprobe跟踪glibc malloc 函数的工具,并统计malloc 内存的总量。
#!/usr/bin/python
#
# mallocstacks Trace malloc() calls in a process and print the full
# stack trace for all callsites.
# For Linux, uses BCC, eBPF. Embedded C.
#
# This script is a basic example of the new Linux 4.6+ BPF_STACK_TRACE
# table API.
#
# Copyright 2016 GitHub, Inc.
# Licensed under the Apache License, Version 2.0 (the "License")
from __future__ import print_function
from bcc import BPF
from bcc.utils import printb
from time import sleep
import sys
if len(sys.argv) < 2:
print("USAGE: mallocstacks PID [NUM_STACKS=1024]")
exit()
pid = int(sys.argv[1])
if len(sys.argv) == 3:
try:
assert int(sys.argv[2]) > 0, ""
except (ValueError, AssertionError) as e:
print("USAGE: mallocstacks PID [NUM_STACKS=1024]")
print("NUM_STACKS must be a non-zero, positive integer")
exit()
stacks = sys.argv[2]
else:
stacks = "1024"
# load BPF program
b = BPF(text="""
#include <uapi/linux/ptrace.h>
BPF_HASH(calls, int);
BPF_STACK_TRACE(stack_traces, """ + stacks + """);
int alloc_enter(struct pt_regs *ctx, size_t size) {
int key = stack_traces.get_stackid(ctx, BPF_F_USER_STACK);
if (key < 0)
return 0;
// could also use `calls.increment(key, size);`
u64 zero = 0, *val;
val = calls.lookup_or_try_init(&key, &zero);
if (val) {
(*val) += size;
}
return 0;
};
""")
b.attach_uprobe(name="c", sym="malloc", fn_name="alloc_enter", pid=pid)
print("Attaching to malloc in pid %d, Ctrl+C to quit." % pid)
# sleep until Ctrl-C
try:
sleep(99999999)
except KeyboardInterrupt:
pass
calls = b.get_table("calls")
stack_traces = b.get_table("stack_traces")
for k, v in reversed(sorted(calls.items(), key=lambda c: c[1].value)):
print("%d bytes allocated at:" % v.value)
if k.value > 0 :
for addr in stack_traces.walk(k.value):
printb(b"\t%s" % b.sym(addr, pid, show_offset=True))libbpf是linux 源码树中的ebpf 开发包。同时在github上也有独立的代码仓库。 这里推荐使用libbpf-bootstrap这个项目
libbpf-bootstrap是使用 libbpf 和 BPF CO-RE 进行 BPF 应用程序开发的脚手架项目 首先克隆libbpf-bootstrap仓库
然后同步子模块
cd libbpf-bootstrap git submodule init git submodule update
注意,子模块中包含bpftool,bpftool中还有子模块需要同步 在bpftool目录下重复以上步骤
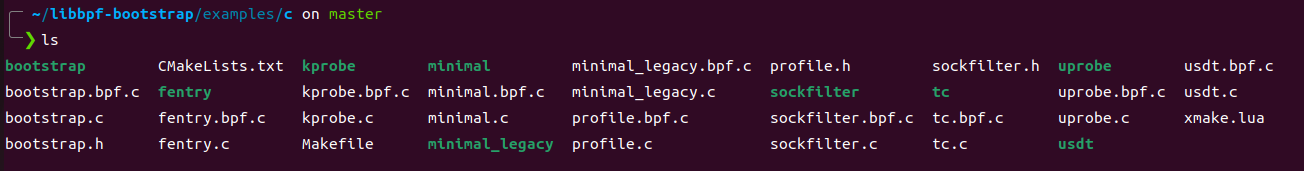
libbpf-bootstrap中包含以下目录

这里进入example/c中,这里包含一些示例工具 直接make编译 等编译完成后,在此目录下会生成可执行文件
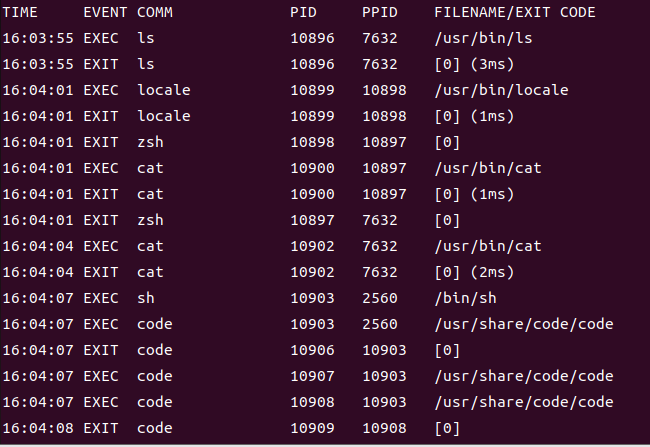
先运行一下bootstrap,这里要用root权限运行
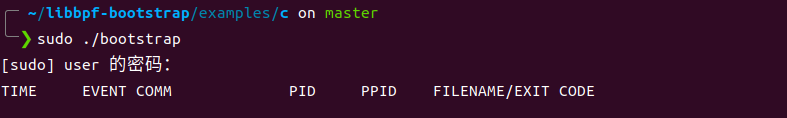
bootstrap程序会追踪所有的exec和exit系统调用,每次程序运行时,bootstrap就会输出运行程序的信息。
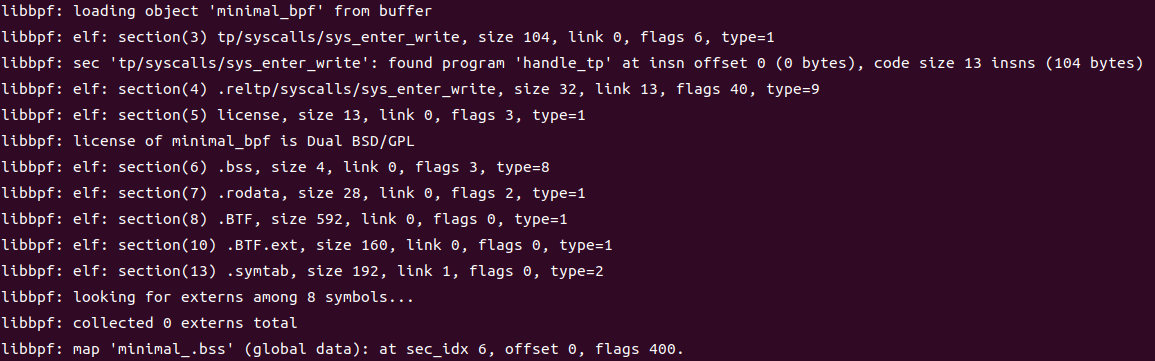
再看看minimal,这是一个最小ebpf程序。
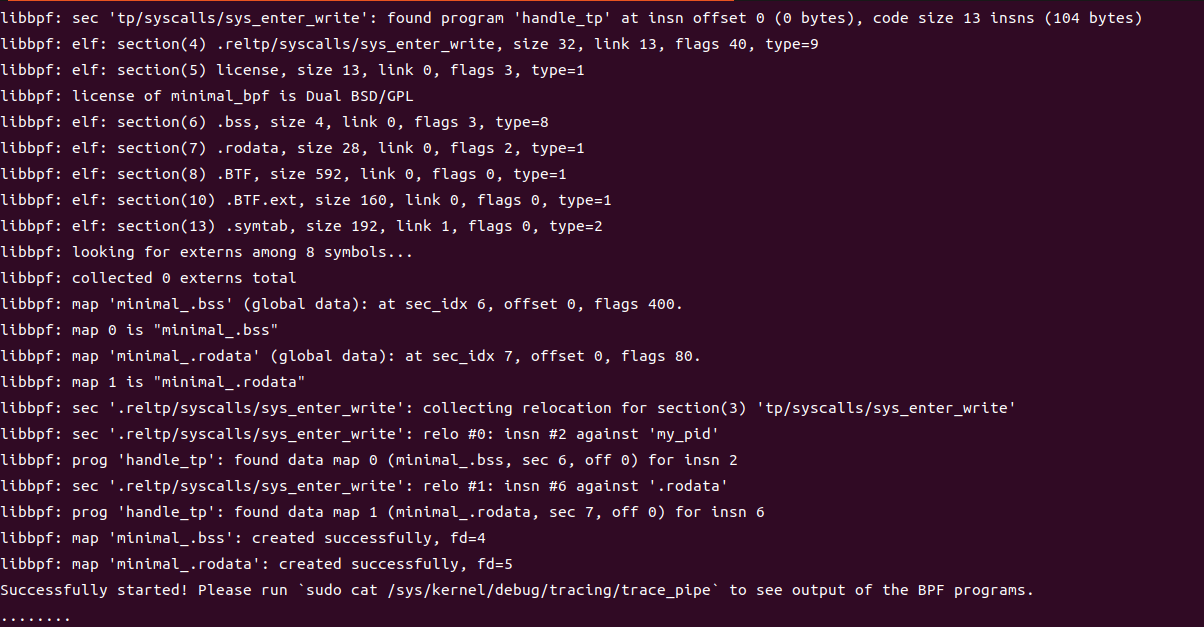
运行后输出大量信息,最后有提示让我们运行sudo cat /sys/kernel/debug/tracing/trace_pipe来查看输出 运行这个命令
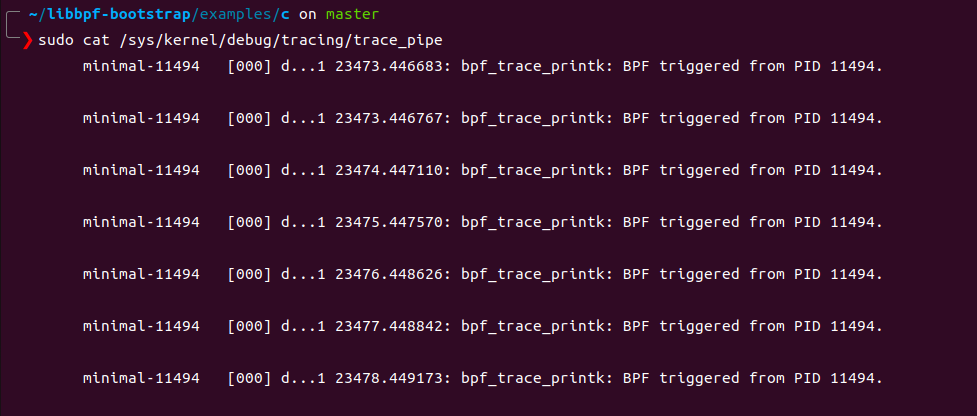
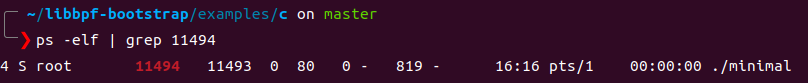
minimal 会追踪所有的write系统调用,并打印出调用write的进程的pid 这里看到pid为11494,ps 查询一下这个进程,发现就是minimal
来看看minimal的源码,这个程序主要有两个C文件组成,minimal.c和minimal.bpf.c前者为此程序的源码,后者为插入内核虚拟机的ebpf代码。
// SPDX-License-Identifier: (LGPL-2.1 OR BSD-2-Clause)
/* Copyright (c) 2020 Facebook */
static int libbpf_print_fn(enum libbpf_print_level level, const char *format, va_list args)
{
return vfprintf(stderr, format, args);
}
int main(int argc, char **argv)
{
struct minimal_bpf *skel;
int err;
libbpf_set_strict_mode(LIBBPF_STRICT_ALL);
/* Set up libbpf errors and debug info callback */
libbpf_set_print(libbpf_print_fn);
/* Open BPF application */
skel = minimal_bpf__open();
if (!skel) {
fprintf(stderr, "Failed to open BPF skeleton\n");
return 1;
}
/* ensure BPF program only handles write() syscalls from our process */
skel->bss->my_pid = getpid();
/* Load & verify BPF programs */
err = minimal_bpf__load(skel);
if (err) {
fprintf(stderr, "Failed to load and verify BPF skeleton\n");
goto cleanup;
}
/* Attach tracepoint handler */
err = minimal_bpf__attach(skel);
if (err) {
fprintf(stderr, "Failed to attach BPF skeleton\n");
goto cleanup;
}
printf("Successfully started! Please run `sudo cat /sys/kernel/debug/tracing/trace_pipe` "
"to see output of the BPF programs.\n");
for (;;) {
/* trigger our BPF program */
fprintf(stderr, ".");
sleep(1);
}
cleanup:
minimal_bpf__destroy(skel);
return -err;
}首先看一下minimal.c的内容,在main函数中首先调用了libbpf_set_strict_mode(LIBBPF_STRICT_ALL);设置为libbpf v1.0模式。此模式下错误代码直接通过函数返回值传递,不再需要检查errno。 之后调用libbpf_set_print(libbpf_print_fn);将程序中一个自定义输出函数设置为调试输出的回调函数,即运行minimal的这些输出全都时通过libbpf_print_fn输出的。
然后在minimal.c:24调用生成的minimal.skel.h中的预定义函数minimal_bpfopen打开bpf程序,这里返回一个minimal_bpf类型的对象(c中使用结构体模拟对象)。 在31行将minimal_bpf对象的bss子对象的my_pid属性设置为当前进程pid 这里minimal_bpf对象和bss都由minimal.bpf.c代码编译而来。minimal.bpf.c经过clang 编译连接,生成minimal.bpf.o,这是一个elf文件,其中包含bss段,这个段内通常储存着minimal.bpf.c中所有经过初始化的变量。 skel->bss->my_pid = getpid();就是直接将minimal.bpf.o中的my_pid设置为minimal进程的pid。 之后在34行调用minimal_bpfload(skel);加载并验证ebpf程序。 41行调用minimal_bpfattach(skel);使ebpf程序附加到bpf源码中声明的跟踪点上。 此时ebpf程序已经开始运行了。ebpf中通过bpf_printk输出的内容会写入linux debugFS中的trace_pipe中。可以使用sudo cat /sys/kernel/debug/tracing/trace_pipe输出到终端里。 之后minimal程序会进入一个死循环,以维持ebpf程序的运行。当用户按下发送SIGINT信号后就会调用minimal_bpfdestroy(skel);卸载内核中的ebpf程序,之后退出。
接下来看minimal.bpf.c 这是ebpf程序的源码,是要加载到内核中的ebpf虚拟机中运行的,由于在运行在内核中,具有得天独厚的地理位置,可以访问系统中所有资源,再配合上众多的tracepoint,就可以发挥出强大的追踪能力。 下面是minimal.bpf.c的源码
// SPDX-License-Identifier: GPL-2.0 OR BSD-3-Clause
/* Copyright (c) 2020 Facebook */
char LICENSE[] SEC("license") = "Dual BSD/GPL";
int my_pid = 0;
SEC("tp/syscalls/sys_enter_write")
int handle_tp(void *ctx)
{
int pid = bpf_get_current_pid_tgid() >> 32;
if (pid != my_pid)
return 0;
bpf_printk("BPF triggered from PID %d.\n", pid);
return 0;
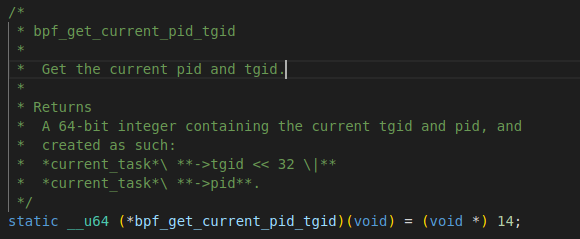
}minimal.bpf.c会被clang 编译器编译为ebpf字节码,然后通过bpftool将其转换为minimal.skel.h头文件,以供minimal.c使用。 此代码中定义并初始化了一个全局变量my_pid,经过编译连接后此变量会进入elf文件的bss段中。 然后,代码中定义了一个函数int handle_tp(void *ctx),此函数中通过调用bpf_get_current_pid_tgid() >> 32获取到调用此函数的进程pid
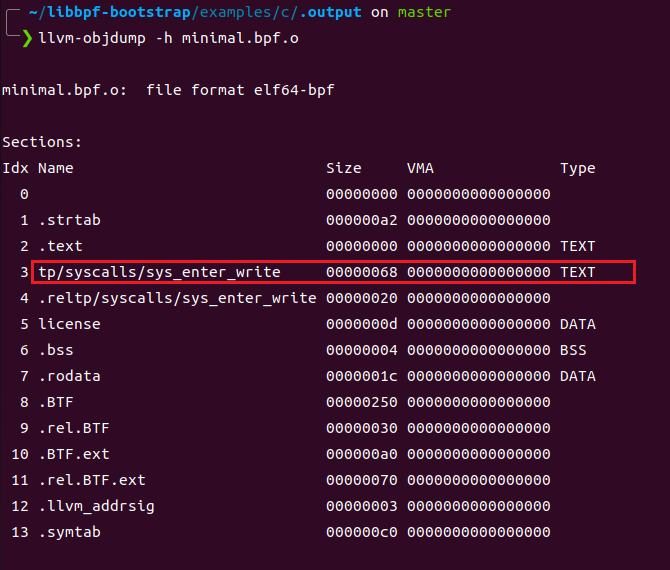
然后比较pid与my_pid的值,如果相同则调用bpf_printk输出"BPF triggered from PID %d\n” 这里由于handle_tp函数是通过SEC宏附加在write系统调用上,所以在调用write()时,handle_tp也会被调用,从而实现追踪系统调用的功能。 SEC宏在bpf程序中处于非常重要的地位。可以参考此文档 SEC宏可以指定ebpf函数附加的点,包括系统调用,静态tracepoint,动态的kprobe和uprobe,以及USDT等等。 Libbpf 期望 BPF 程序使用SEC()宏注释,其中传入的字符串参数SEC()确定 BPF 程序类型和可选的附加附加参数,例如 kprobe 程序要附加的内核函数名称或 cgroup 程序的挂钩类型。该SEC()定义最终被记录为 ELF section name。
通过llvm-objdump 可以看到编译后的epbf程序文件包含一个以追踪点命名的section
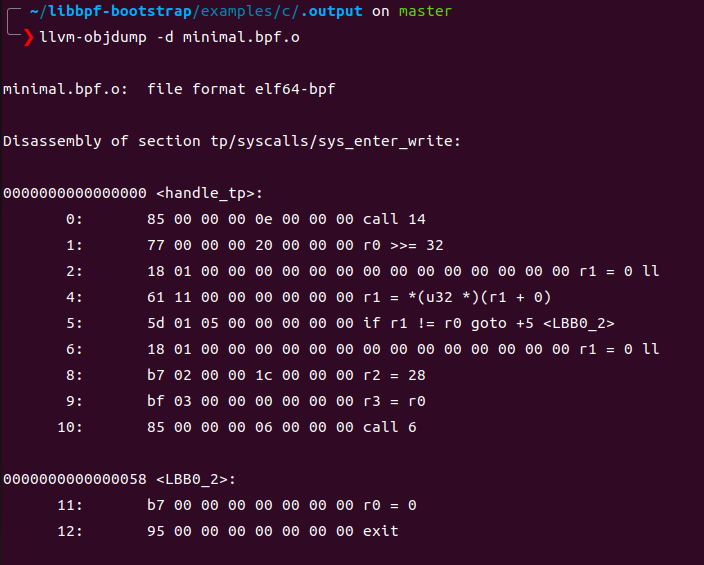
ebpf程序可以使用llvm-objdump -d dump 出ebpf字节码
bpftrace 提供了一种类似awk 的脚本语言,通过编写脚本,配合bpftrace支持的追踪点,可以实现非常强大的追踪功能
安装
sudo apt-get update sudo apt-get install -y \ bison \ cmake \ flex \ g++ \ git \ libelf-dev \ zlib1g-dev \ libfl-dev \ systemtap-sdt-dev \ binutils-dev \ libcereal-dev \ llvm-12-dev \ llvm-12-runtime \ libclang-12-dev \ clang-12 \ libpcap-dev \ libgtest-dev \ libgmock-dev \ asciidoctor git clone https://github.com/iovisor/bpftrace mkdir bpftrace/build; cd bpftrace/build; ../build-libs.sh cmake -DCMAKE_BUILD_TYPE=Release .. make -j8 sudo make install
# bpftrace
USAGE:
bpftrace [options] filename
bpftrace [options] -e 'program'
OPTIONS:
-B MODE output buffering mode ('line', 'full', or 'none')
-d debug info dry run
-dd verbose debug info dry run
-e 'program' execute this program
-h show this help message
-I DIR add the specified DIR to the search path for include files.
--include FILE adds an implicit #include which is read before the source file is preprocessed.
-l [search] list probes
-p PID enable USDT probes on PID
-c 'CMD' run CMD and enable USDT probes on resulting process
-q keep messages quiet
-v verbose messages
-k emit a warning when a bpf helper returns an error (except read functions)
-kk check all bpf helper functions
--version bpftrace version
ENVIRONMENT:
BPFTRACE_STRLEN [default: 64] bytes on BPF stack per str()
BPFTRACE_NO_CPP_DEMANGLE [default: 0] disable C++ symbol demangling
BPFTRACE_MAP_KEYS_MAX [default: 4096] max keys in a map
BPFTRACE_MAX_PROBES [default: 512] max number of probes bpftrace can attach to
BPFTRACE_MAX_BPF_PROGS [default: 512] max number of generated BPF programs
BPFTRACE_CACHE_USER_SYMBOLS [default: auto] enable user symbol cache
BPFTRACE_VMLINUX [default: none] vmlinux path used for kernel symbol resolution
BPFTRACE_BTF [default: none] BTF file
EXAMPLES:
bpftrace -l '*sleep*'
list probes containing "sleep"
bpftrace -e 'kprobe:do_nanosleep { printf("PID %d sleeping...\n", pid); }'
trace processes calling sleep
bpftrace -e 'tracepoint:raw_syscalls:sys_enter { @[comm] = count(); }'
count syscalls by process namebpftrace语法由以下一个或多个action block结构组成,且语法关键字与c语言类似
probe[,probe]
/predicate/ {
  action
}
probe:探针,可以使用bpftrace -l 来查看支持的所有tracepoint和kprobe探针
Predicate(可选):在 / / 中指定 action 执行的条件。如果为True,就执行 action
action:在事件触发时运行的程序,每行语句必须以 ; 结尾,并且用{}包起来
//:单行注释
/**/:多行注释
->:访问c结构体成员,例如:bpftrace -e 'tracepoint:syscalls:sys_enter_openat { printf("%s %s\n", comm, str(args->filename)); }'
struct:结构声明,在bpftrace脚本中可以定义自己的结构
bpftrace -e 选项可以指定运行一个单行程序 1、追踪openat系统调用
bpftrace -e 'tracepoint:syscalls:sys_enter_openat { printf("%s %s\n", comm, str(args->filename)); }'
2、系统调用计数
bpftrace -e 'tracepoint:raw_syscalls:sys_enter { @[comm] = count(); }'
3、计算每秒发生的系统调用数量
bpftrace -e 'tracepoint:raw_syscalls:sys_enter { @ = count(); } interval:s:1 { print(@); clear(@); }'
还可以将bpftrace程序作为一个脚本文件,并且使用shebang#!/usr/local/bin/bpftrace可以使其独立运行 例如:
1 #!/usr/local/bin/bpftrace
2
3 tracepoint:syscalls:sys_enter_nanosleep
4 {
5   printf("%s is sleeping.\n", comm);
6 }bpftrace支持以下类型的探针:
kprobe- 内核函数启动
kretprobe- 内核函数返回
uprobe- 用户级功能启动
uretprobe- 用户级函数返回
tracepoint- 内核静态跟踪点
usdt- 用户级静态跟踪点
profile- 定时采样
interval- 定时输出
software- 内核软件事件
hardware- 处理器级事件